Parameters exploration
BioImageIT provides a way to find to explore the parameter space of a tool to find the best combination for a given application.
In this tutorial, we will see it in action.
The “Generate” tool enables to generate a single column DataFrame with some values. The values are either defined by the values, arange, linspace, logspace or geomspace parameters (they are exclusive, only the first define parameter will be taken into account). The values parameter generates a list from coma-separated numbers (the value 11,22,33 will create a column with the values [11, 22, 33]).
The arange, linspace, logspace or geomspace parameters enable to generate arrays from the corresponding numpy functions:
arangegenerates evenly spaced values within a given interval (see arange). For example0,5,2will return[0, 2, 4].linspacegenerates a number of values over a specified interval (see linspace). For example0,2,5will return[0, 0.5, 1.0, 1.5, 2.0].logspacegenerates numbers spaced evenly on a log scale (base 10) (see logspace). For example2,3,4will return[100.0, 215.443, 464.159, 1000.0].geomspacegenerates numbers spaced evenly on a log scale (a geometric progression) (see geomspace). This is similar to logspace, but with endpoints specified directly. Each output sample is a constant multiple of the previous. For example10, 1000, 3will return[10.0, 100.0, 1000.0].
The columnName parameter defines the column name in the generated DataFrame.
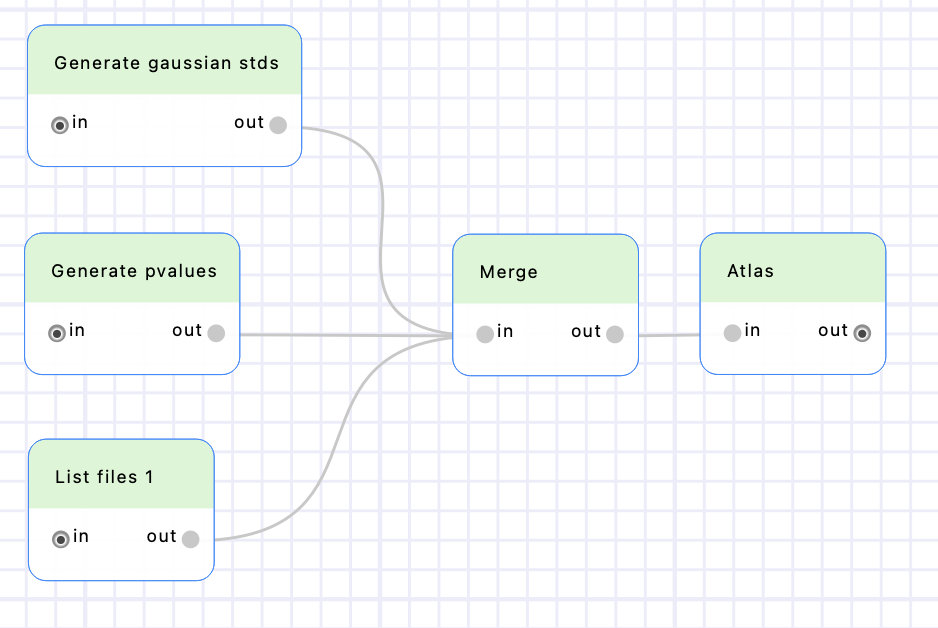
We will use the “Generate” node to create a matrix of values to feed the “Atlas” node. This will enable to test “Atlas” with a number of parameter combination and find the best one.
Add two “Generate” nodes and rename them “Generate gaussian_std” and “Generate pvalue”. Set the values parameter of the “Generate gaussian_std” to 30,60,120. Set the logspace parameter of the “Generate pvalue” to -3,-5,3 to generale the values [0.001, 0.0001, 0.00001].
Add “List files” node to open the FISH folder from the FISH analysis tutorial. Filter the images to obtain a single image by entering 13432* in the filter parameter.
Add a “Merge” node. This node enables to merge its input DataFrames using the pandas DataFrame.merge() method. Select “Merge” and set its how parameter to cross in order to creates the cartesian product from input DataFrames. Connect the outputs of the three first nodes to the “Merge” input.
You will see that you obtain a DataFrame with all possible combinations of the values generated by the input nodes.
gaussian_std |
p_value |
path |
|---|---|---|
30 |
0.001 |
/path/to/13432_orig.tiff |
30 |
0.0001 |
/path/to/13432_orig.tiff |
30 |
0.00001 |
/path/to/13432_orig.tiff |
60 |
0.001 |
/path/to/13432_orig.tiff |
60 |
0.0001 |
/path/to/13432_orig.tiff |
60 |
0.00001 |
/path/to/13432_orig.tiff |
120 |
0.001 |
/path/to/13432_orig.tiff |
120 |
0.0001 |
/path/to/13432_orig.tiff |
120 |
0.00001 |
/path/to/13432_orig.tiff |
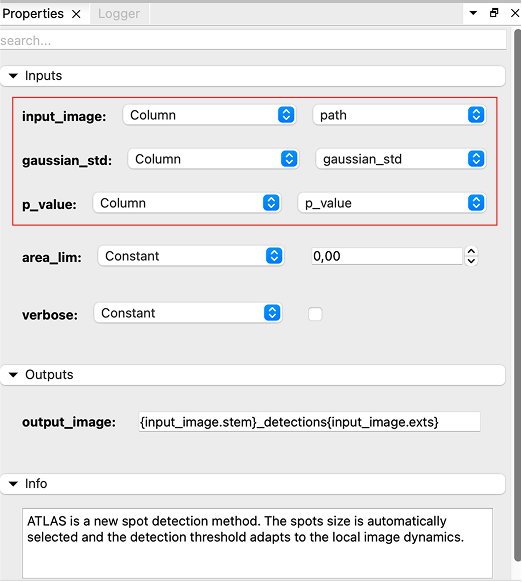
Finally add an “Atlas” node and connect it to the “Merge” output. Set its input_image parameter to the path column (this should be automatic), its gaussian_std parameter to the gaussian_std column, and its pvalue to the pvalue column.
Execute the workflow to perform the 9 Atlas detections on the input image with the generated parameters. Finally, open the resulting images in Napari by clicking on the obtained thumbnails to determine which parameter combination is best for the input image!
Note on the output names
By default, the Atlas output_image is defined as {input_image.stem}_detections{input_image.exts}. Thus, our images are named 13432_orig_detections0.tiff.
BioImageIT automatically suffixed the output paths with indices to avoid collisions (which would result in overwriting the generated files).
This is good because our images have different names, but it would be even better if we had the parameter names in our filename to make them more explicit. For this purpose, we can rename the “Atlas” output to {input_image.stem}_detections_gaussianstd{gaussian_std}_pvalue{p_value}{input_image.ext}.
See the outputs documentation for more information.